scMetabolism Analysis
Introduction
TIP
scMetabolism is a powerful single-cell transcriptome data analysis tool specifically designed for quantifying and visualizing metabolic activity within individual cells. It assesses the enrichment of specific metabolic pathways in cells by scoring gene expression profiles, thereby revealing metabolic pattern heterogeneity across different cell subpopulations, developmental stages, or disease states.
In single-cell research, cellular metabolic reprogramming plays a crucial role in various biological processes such as cell differentiation, immune response, and disease development (e.g., cancer). The emergence of scMetabolism allows researchers to go beyond traditional gene expression analysis and explore the dynamic changes in cell states and functions from the perspective of metabolic function.
Core Functions of scMetabolism
- Metabolic Pathway Activity Quantification: Calculate metabolic pathway enrichment scores for each single cell based on predefined KEGG and REACTOME metabolic pathway gene sets.
- Metabolic Heterogeneity Visualization: Intuitively display metabolic differences between different cell populations through dimensionality reduction plots (t-SNE/UMAP), heatmaps, boxplots, and other forms.
- Cross-sample/Cross-group Comparison: Easily compare changes in cellular metabolic activity under different experimental conditions (e.g., disease group vs. control group).
This document aims to provide single-cell researchers with a comprehensive technical guide for scMetabolism, covering its basic principles, operation methods on the SeekSoul™ Online platform, result interpretation, and practical cases, helping you quickly master and apply this tool for in-depth single-cell metabolic analysis.
Theoretical Basis of scMetabolism
Core Principles
The core idea of scMetabolism is: Infer the activity of a specific metabolic pathway by evaluating the overall expression level of a group of genes related to that pathway in a single cell. This process is mainly based on a variant algorithm of Gene Set Enrichment Analysis (GSEA).
scMetabolism integrates multiple single-cell gene set scoring algorithms, including VISION, AUCell, ssgsea, and gsva. Users can choose the most suitable algorithm according to their research needs. The basic steps are as follows:
Gene Set Definition: scMetabolism has built-in metabolic pathway gene sets from authoritative databases such as KEGG (Kyoto Encyclopedia of Genes and Genomes) and REACTOME. Each gene set contains a group of genes involved in specific metabolic pathways (such as "glycolysis" or "fatty acid synthesis"). Currently, the built-in gene sets support humans and mice.
Single-cell Scoring: For each cell and each metabolic pathway, scMetabolism calculates an enrichment score. This score reflects the relative expression level of the pathway gene set in that cell. Simply put, if a cell highly expresses multiple genes in a metabolic pathway, it will have a higher score on that pathway. The SeekSoul™ Online platform uses the
AUCellmethod by default.Statistics and Visualization: After calculating the score matrix for all cells on all pathways, downstream statistical analysis and visualization can be performed, such as:
- Coloring cells according to metabolic pathway scores on t-SNE or UMAP plots to observe the distribution pattern of pathway activity among different cell populations.
- Drawing heatmaps to show the enrichment of various metabolic pathways in different cell subpopulations.
- Using boxplots or violin plots to compare differences in specific metabolic pathway activities between different groups (such as treatment group vs. control group).
TIP
The advantage of scMetabolism is that it provides a standardized workflow to analyze single-cell metabolism, converting complex gene expression data into intuitive and interpretable metabolic pathway activity maps, greatly simplifying the study of single-cell metabolic heterogeneity.
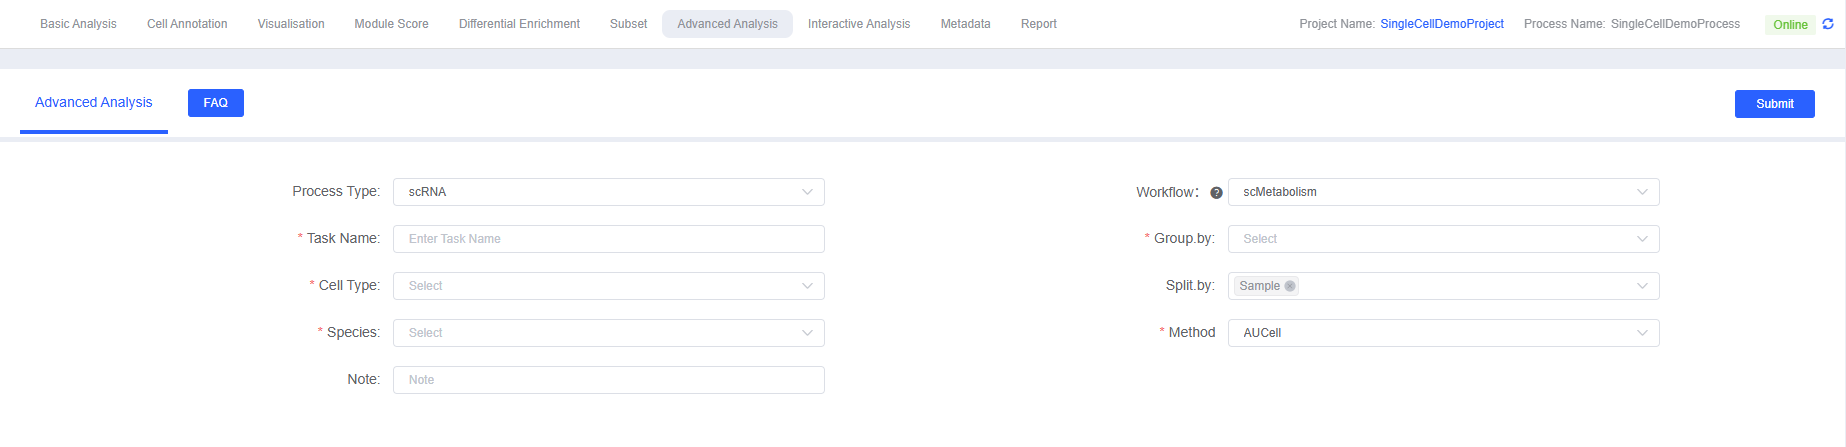
SeekSoul™ Online Platform Operation Guide
On the SeekSoul™ Online platform, the scMetabolism analysis process is designed to be intuitive and easy to use. You don't need to write code; you can complete the analysis through the parameter configuration interface.
Preparation Before Analysis
TIP
Before starting scMetabolism analysis, please ensure:
- Data has been preprocessed: Your single-cell data has undergone standard quality control, dimensionality reduction, clustering, and cell type annotation. This is the basis for any advanced analysis.
- Clear biological questions: Which cell populations or conditions (such as before and after drug treatment) do you want to compare metabolic differences between? Clear questions will guide you to choose the correct grouping and comparison strategies.
Parameter Explanation
The following table details the main parameters and their descriptions of the scMetabolism analysis module on the SeekSoul™ Online platform.
| Interface Parameter | Description |
|---|---|
| Task Name | The name of this analysis task, must start with an English letter, can contain English letters, numbers, underscores, and Chinese characters. |
| Group.by | Select the label corresponding to the cell type or cluster to be analyzed. If you want to analyze annotated cell types, select their corresponding labels, such as CellAnnotation, used in conjunction with Cell Type. |
| Cell Type | Multiple selection, select the cell type or clustering result to be analyzed, such as T cell, NK Cell, and Monocyte. |
| Split.by | The split label when drawing. Generally, select grouping or sample labels, such as Group or Sample. |
| Species | Only supports human and mouse. |
| Method | Includes "VISION" and "AUCell". |
| Note | Custom remark information. |
Operation Process
- Enter the analysis module: Navigate to the "Advanced Analysis" module on the SeekSoul™ Online platform and select "scMetabolism".
- Create a new task: Name your analysis task.
- Configure parameters: According to the above guidelines, select key parameters such as Group.by, Cell Type, and Species.
- Submit the task: After confirming the parameters are correct, click the "Submit" button and wait for the analysis to complete.
- Download and view: After the analysis is completed, download and view the generated analysis report and result files in the task list.
Result Interpretation
The scMetabolism analysis report provides rich visualization charts and data tables to help you comprehensively understand single-cell metabolic heterogeneity. The report mainly includes analysis results based on the KEGG and REACTOME databases.
KEGG Pathway Results
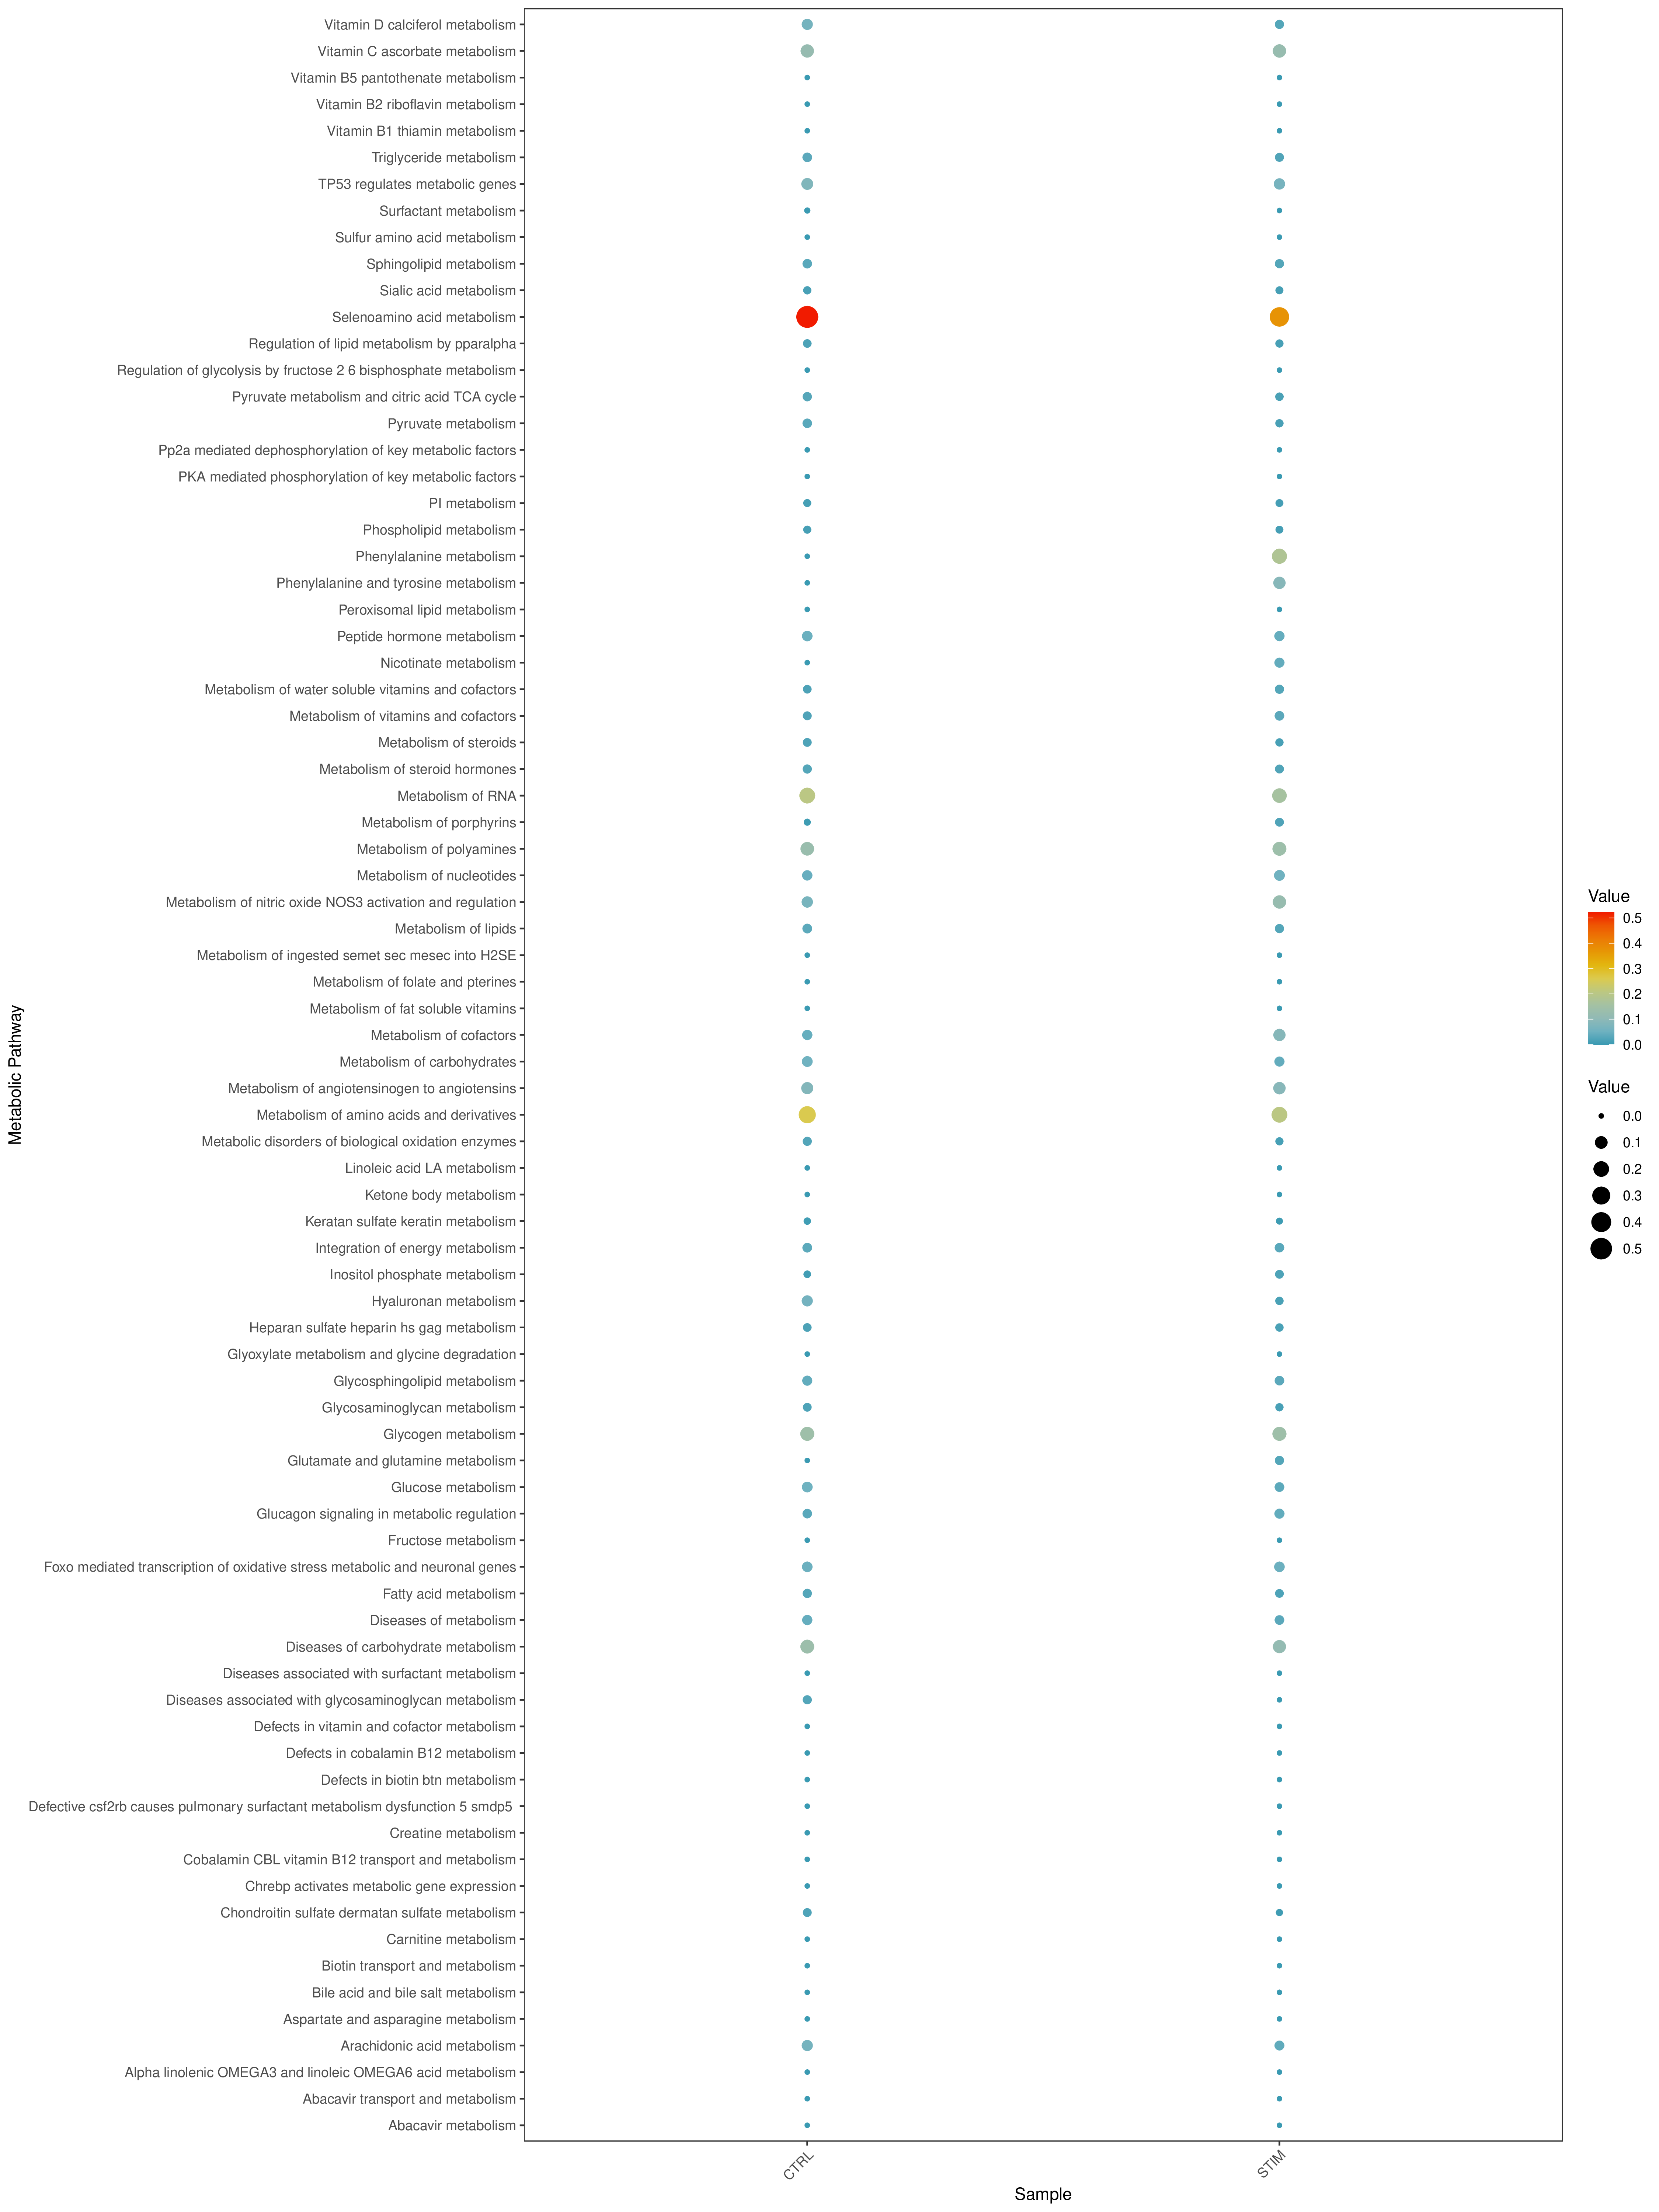
Grouped Activity Average Score Bubble Plot
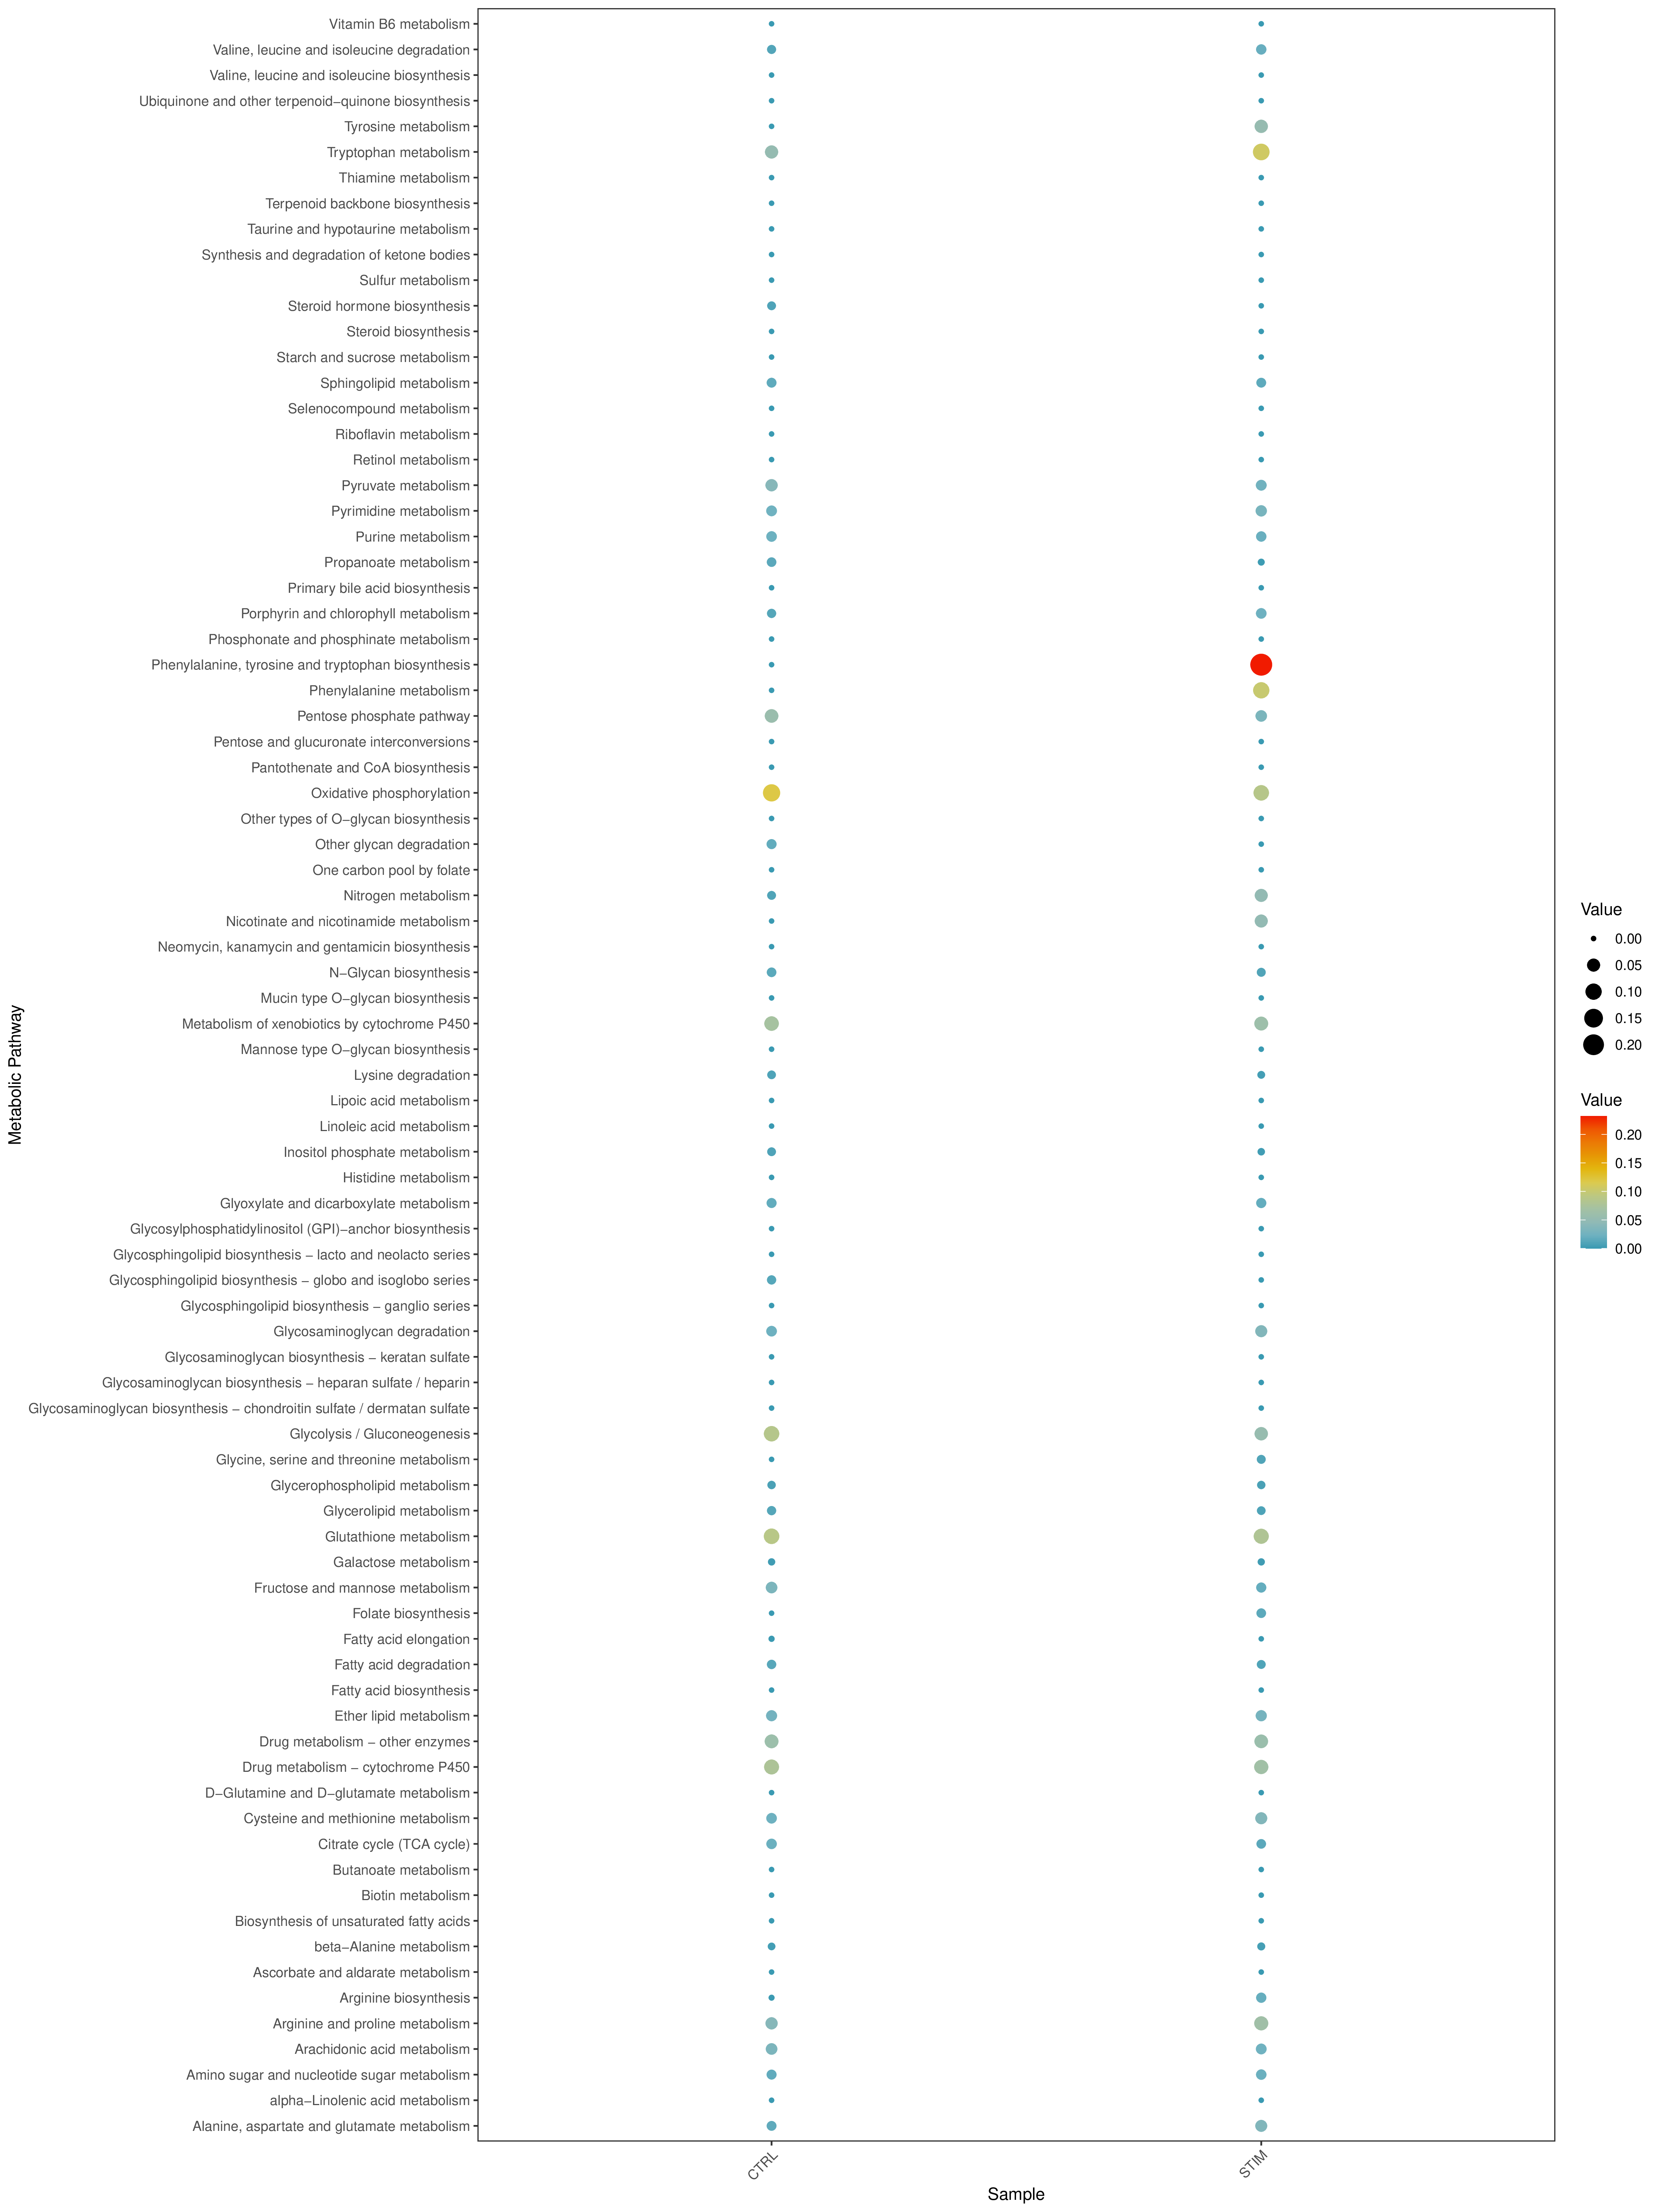
- Chart Interpretation:
- Y-axis: Represents different metabolic pathways.
- X-axis: Represents different samples or groups (determined by the "Split.by" parameter).
- Bubble Size: Indicates the number of genes enriched in the pathway. Larger bubbles indicate more genes.
- Bubble Color: Indicates the pathway's enrichment score (NES, Normalized Enrichment Score). Redder colors indicate higher pathway activity; bluer colors indicate lower activity.
- Analysis Points:
- Quickly identify metabolic pathways with significant differences between different samples/groups. For example, a pathway that is generally red in disease samples and blue in control samples indicates that the pathway is activated in the disease state.
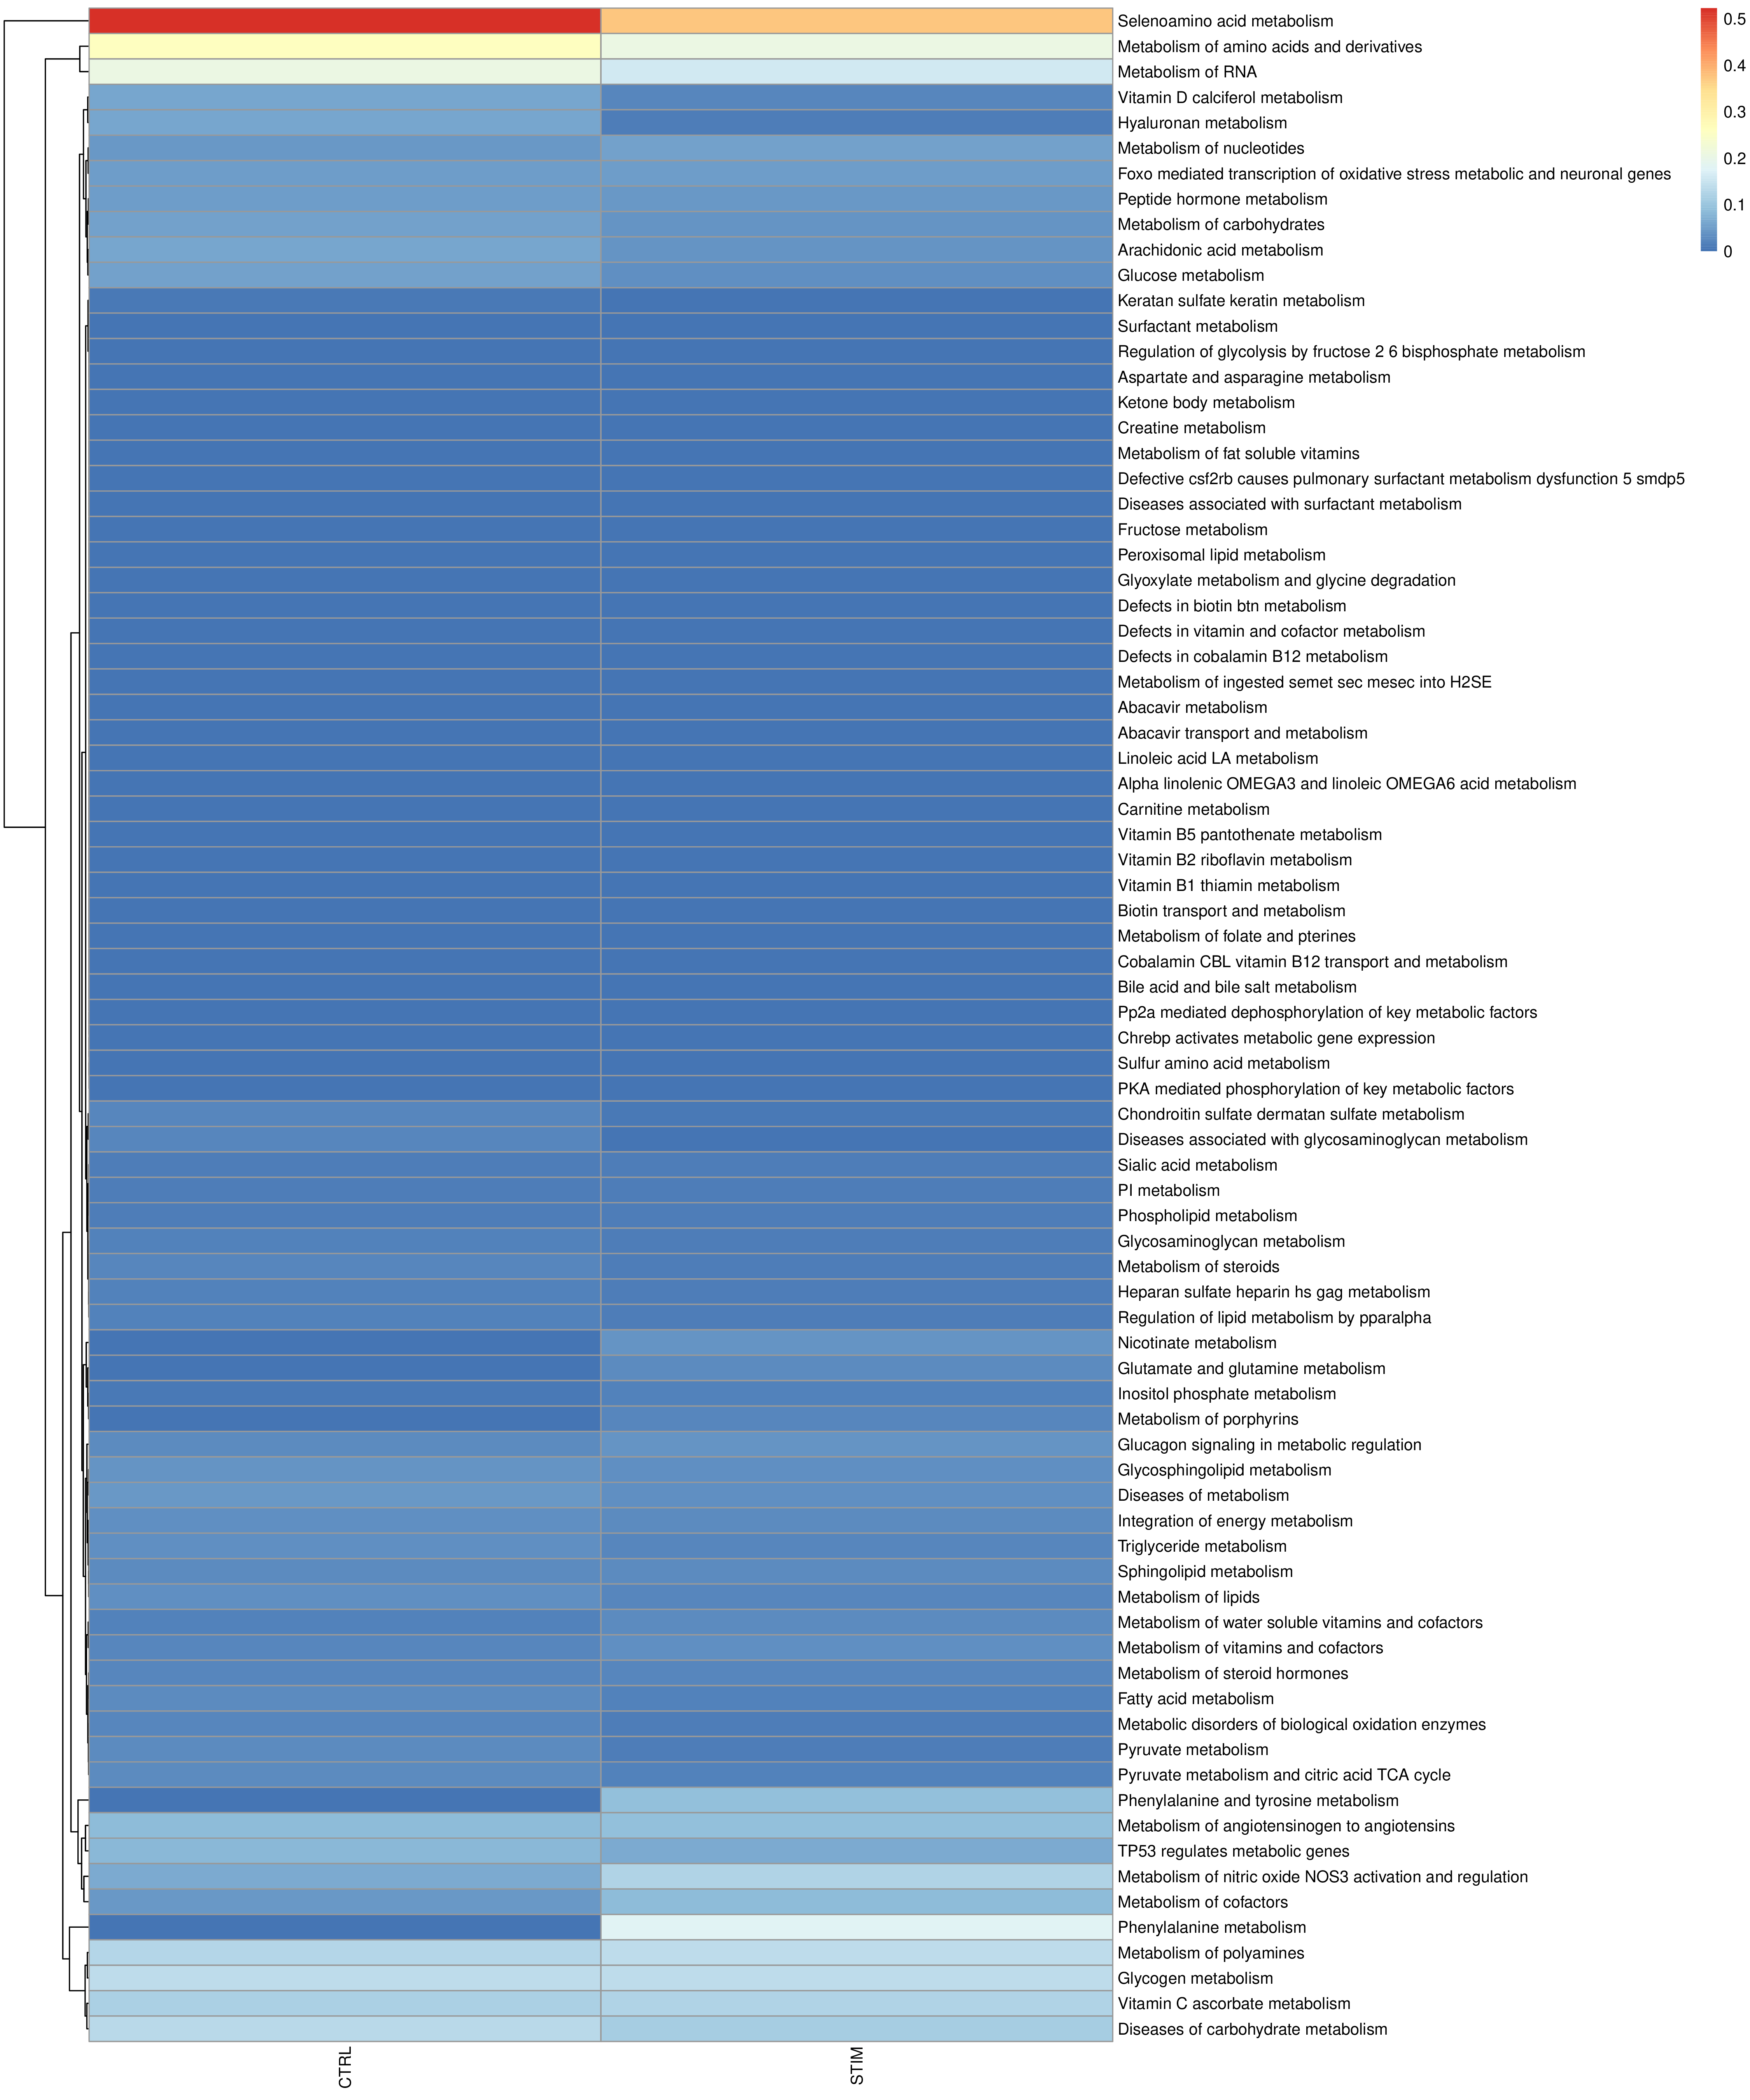
Grouped Activity Average Score Heatmap
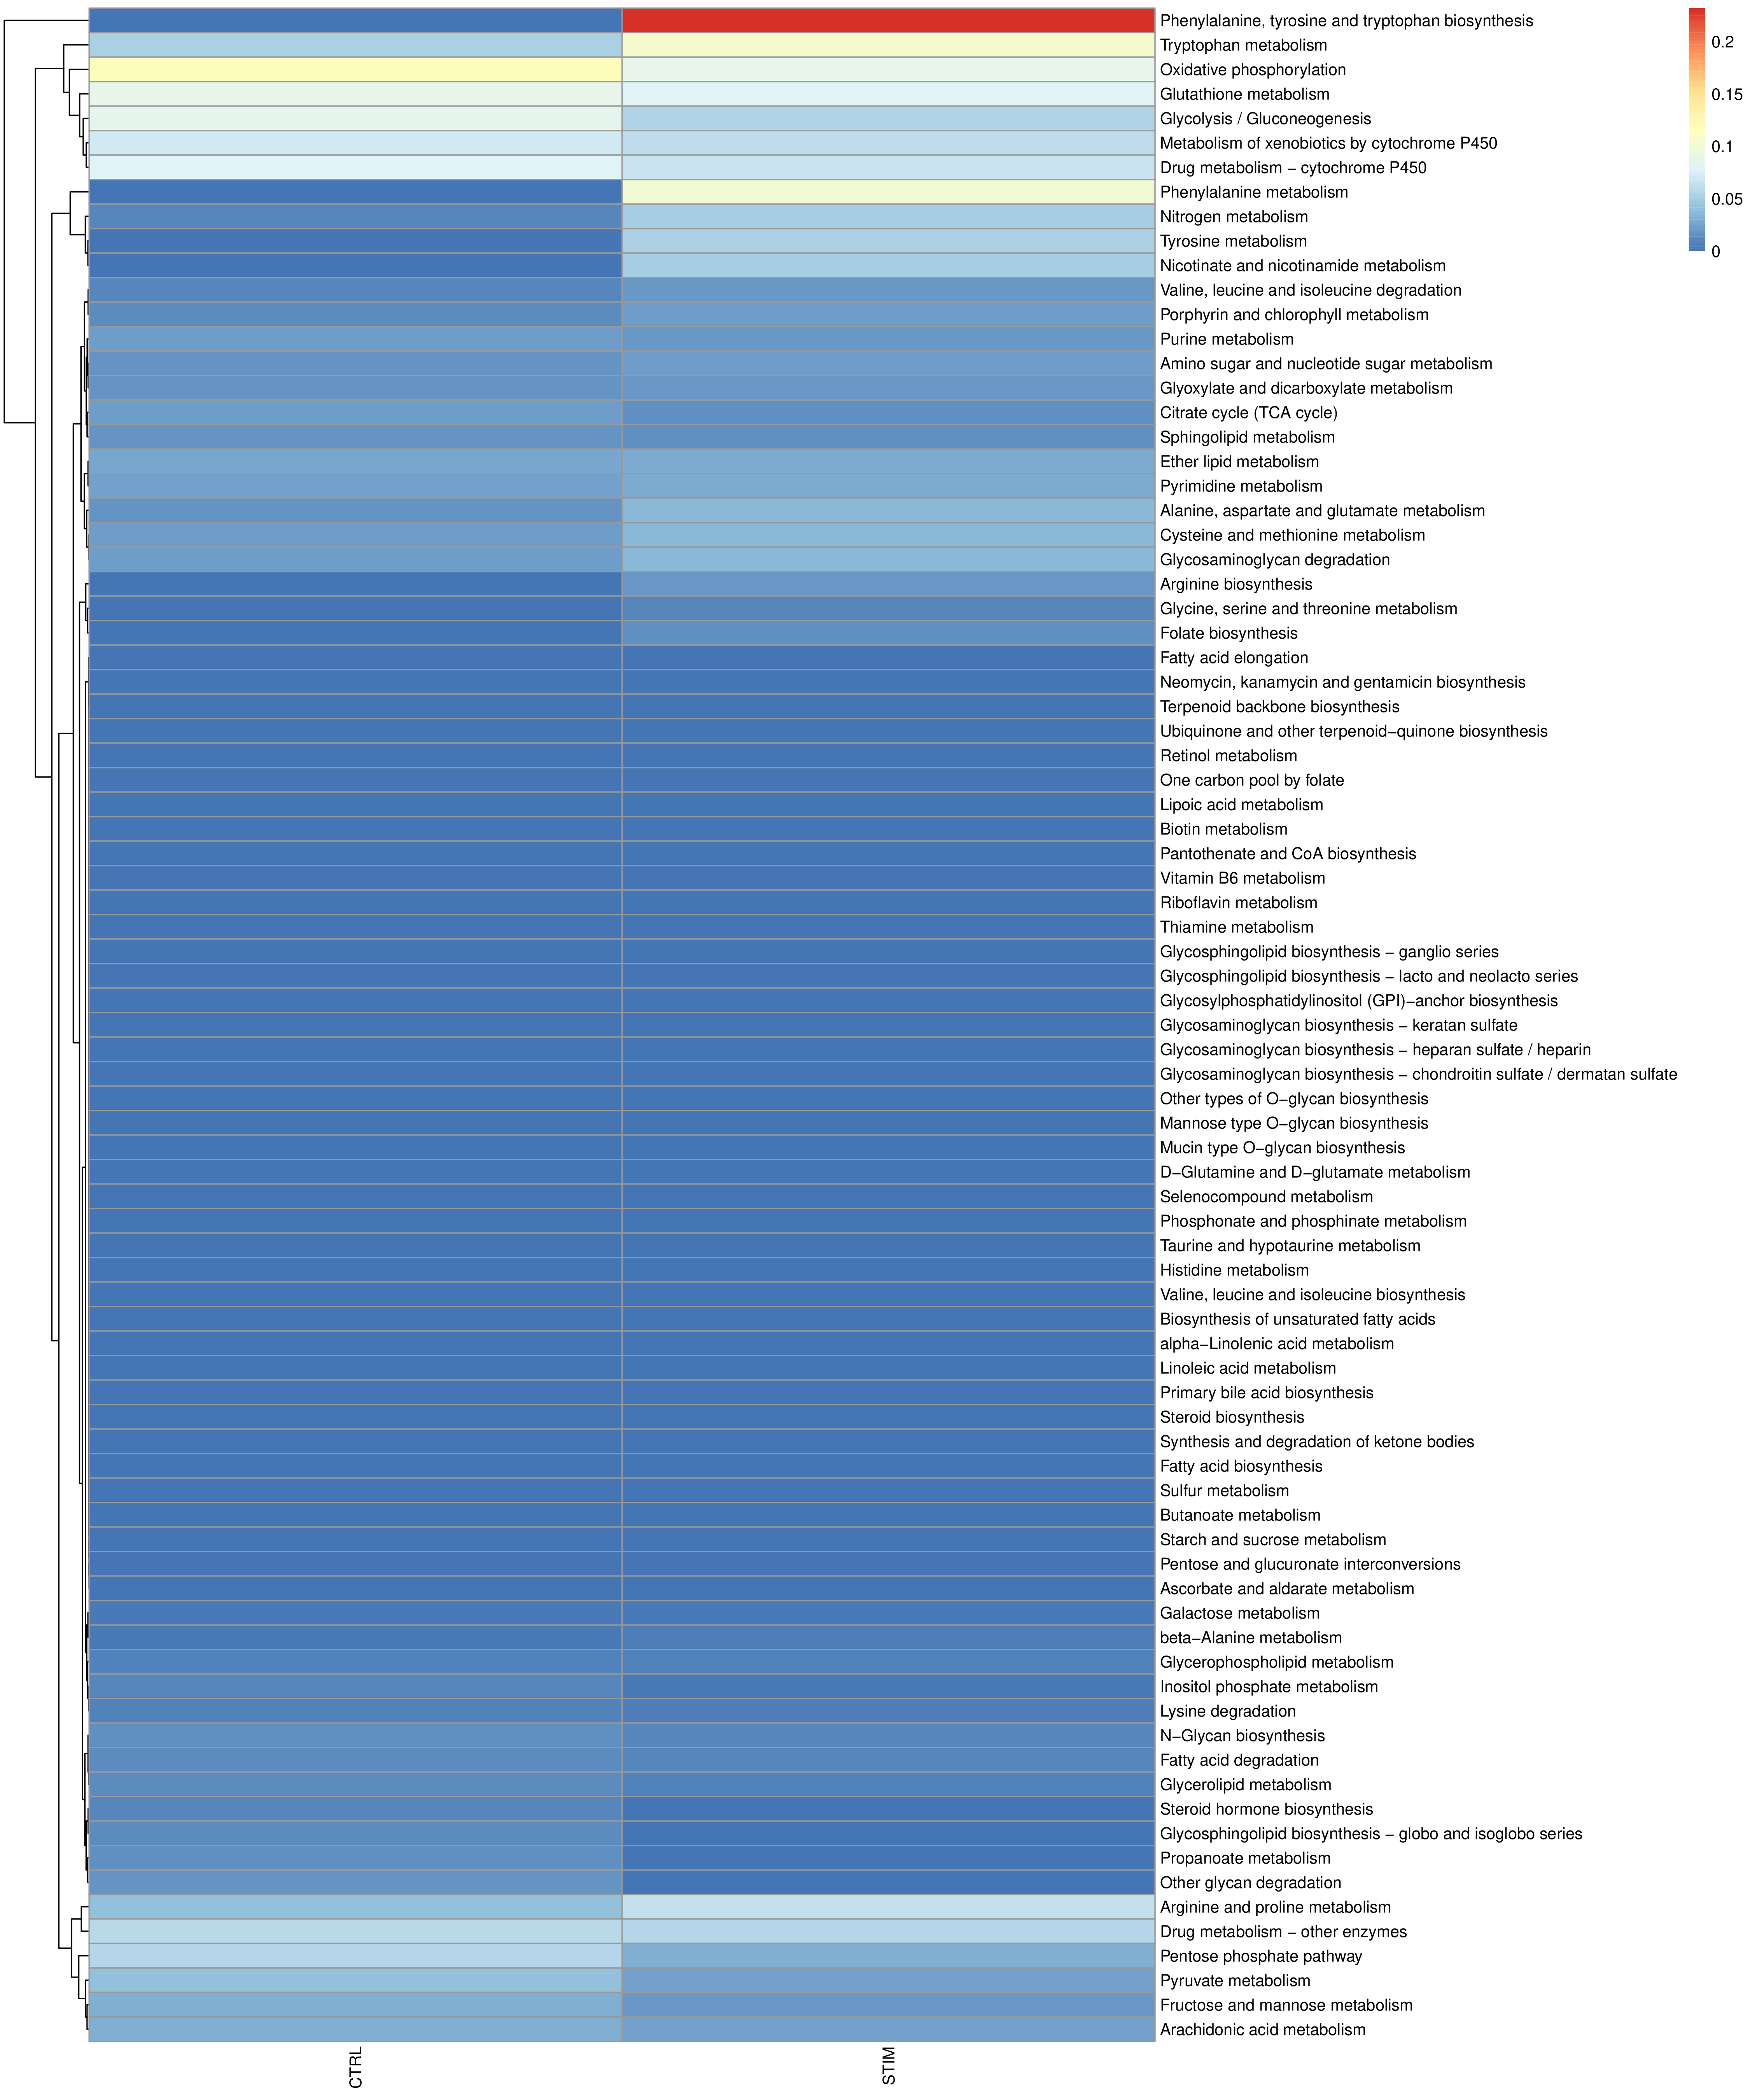
- Chart Interpretation:
- Rows: Represent different metabolic pathways.
- Columns: Represent individual cells, organized according to cell type or group.
- Color: Indicates the enrichment score of each cell in the corresponding pathway. Red indicates high activity, blue indicates low activity.
- Analysis Points:
- Observe the overall metabolic characteristics of specific cell subpopulations. For example, tumor cell populations may show a red area in the "glycolysis" pathway, while immune cell populations may be more active in the "oxidative phosphorylation" pathway.
- Identify metabolic heterogeneity within cell populations. Even within the same cell type, there may be cell subpopulations with different metabolic states.
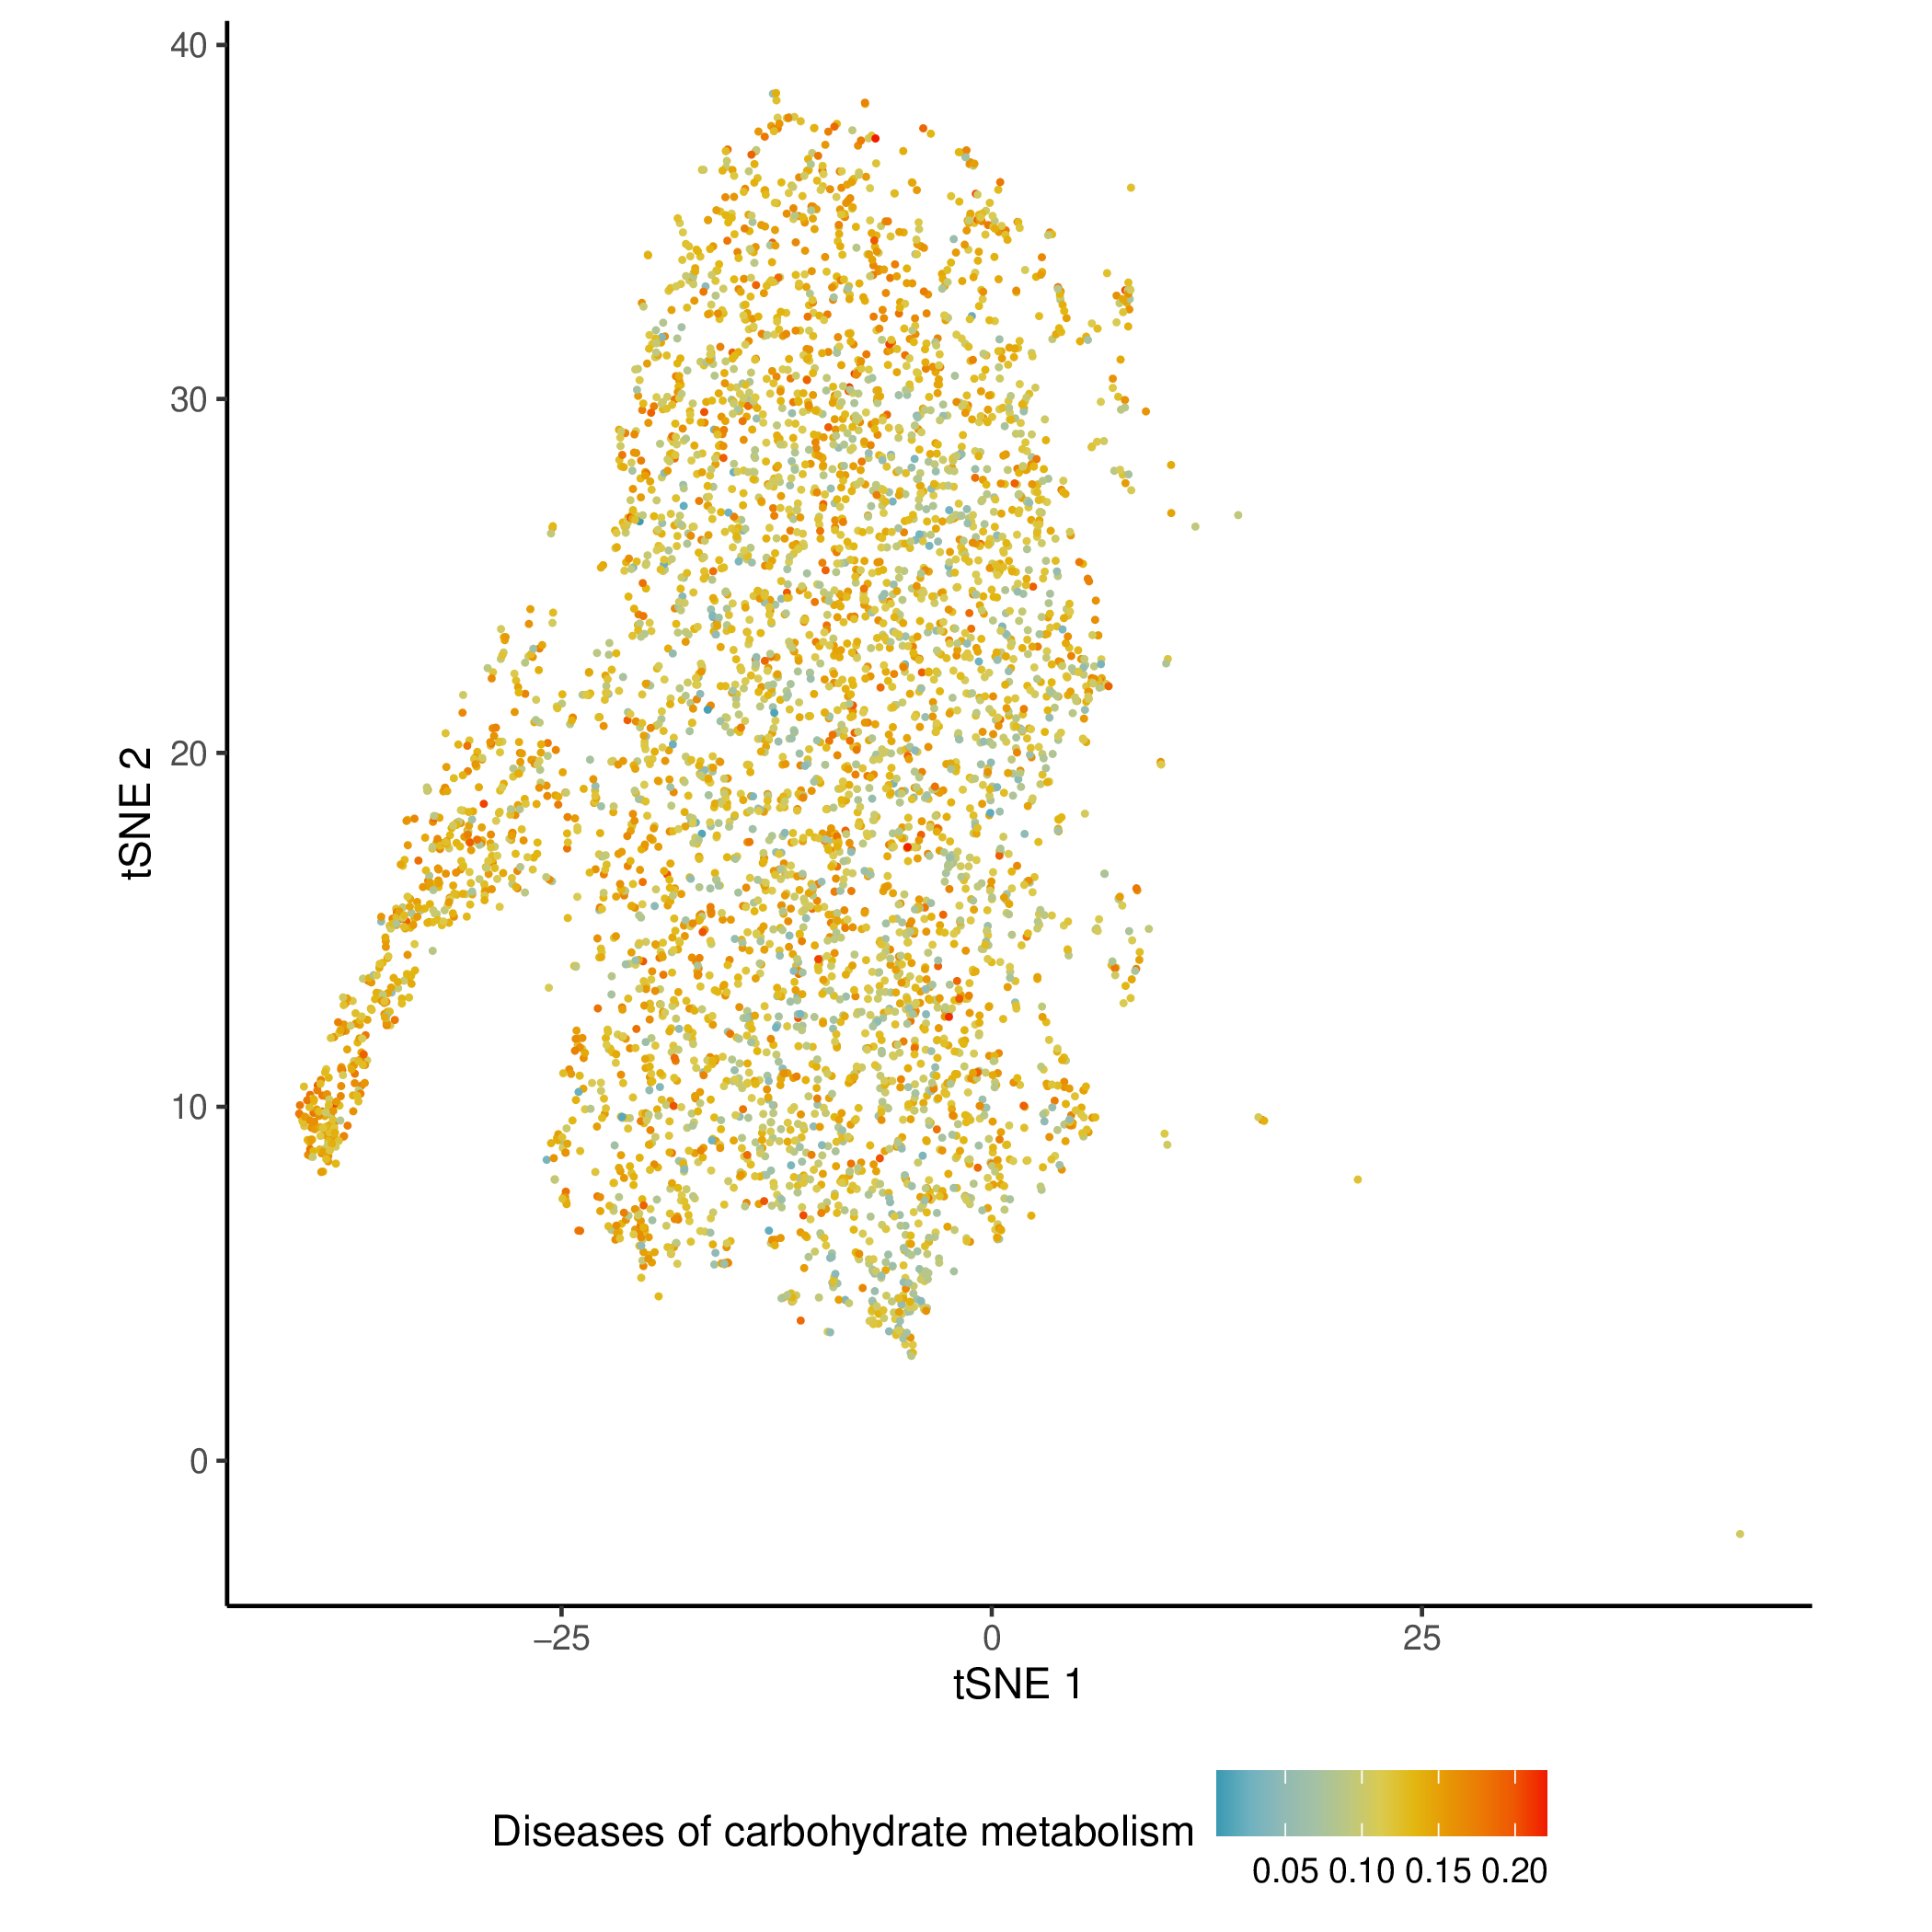
Activity Score Mapping Results on Dimensionality Reduction Plots
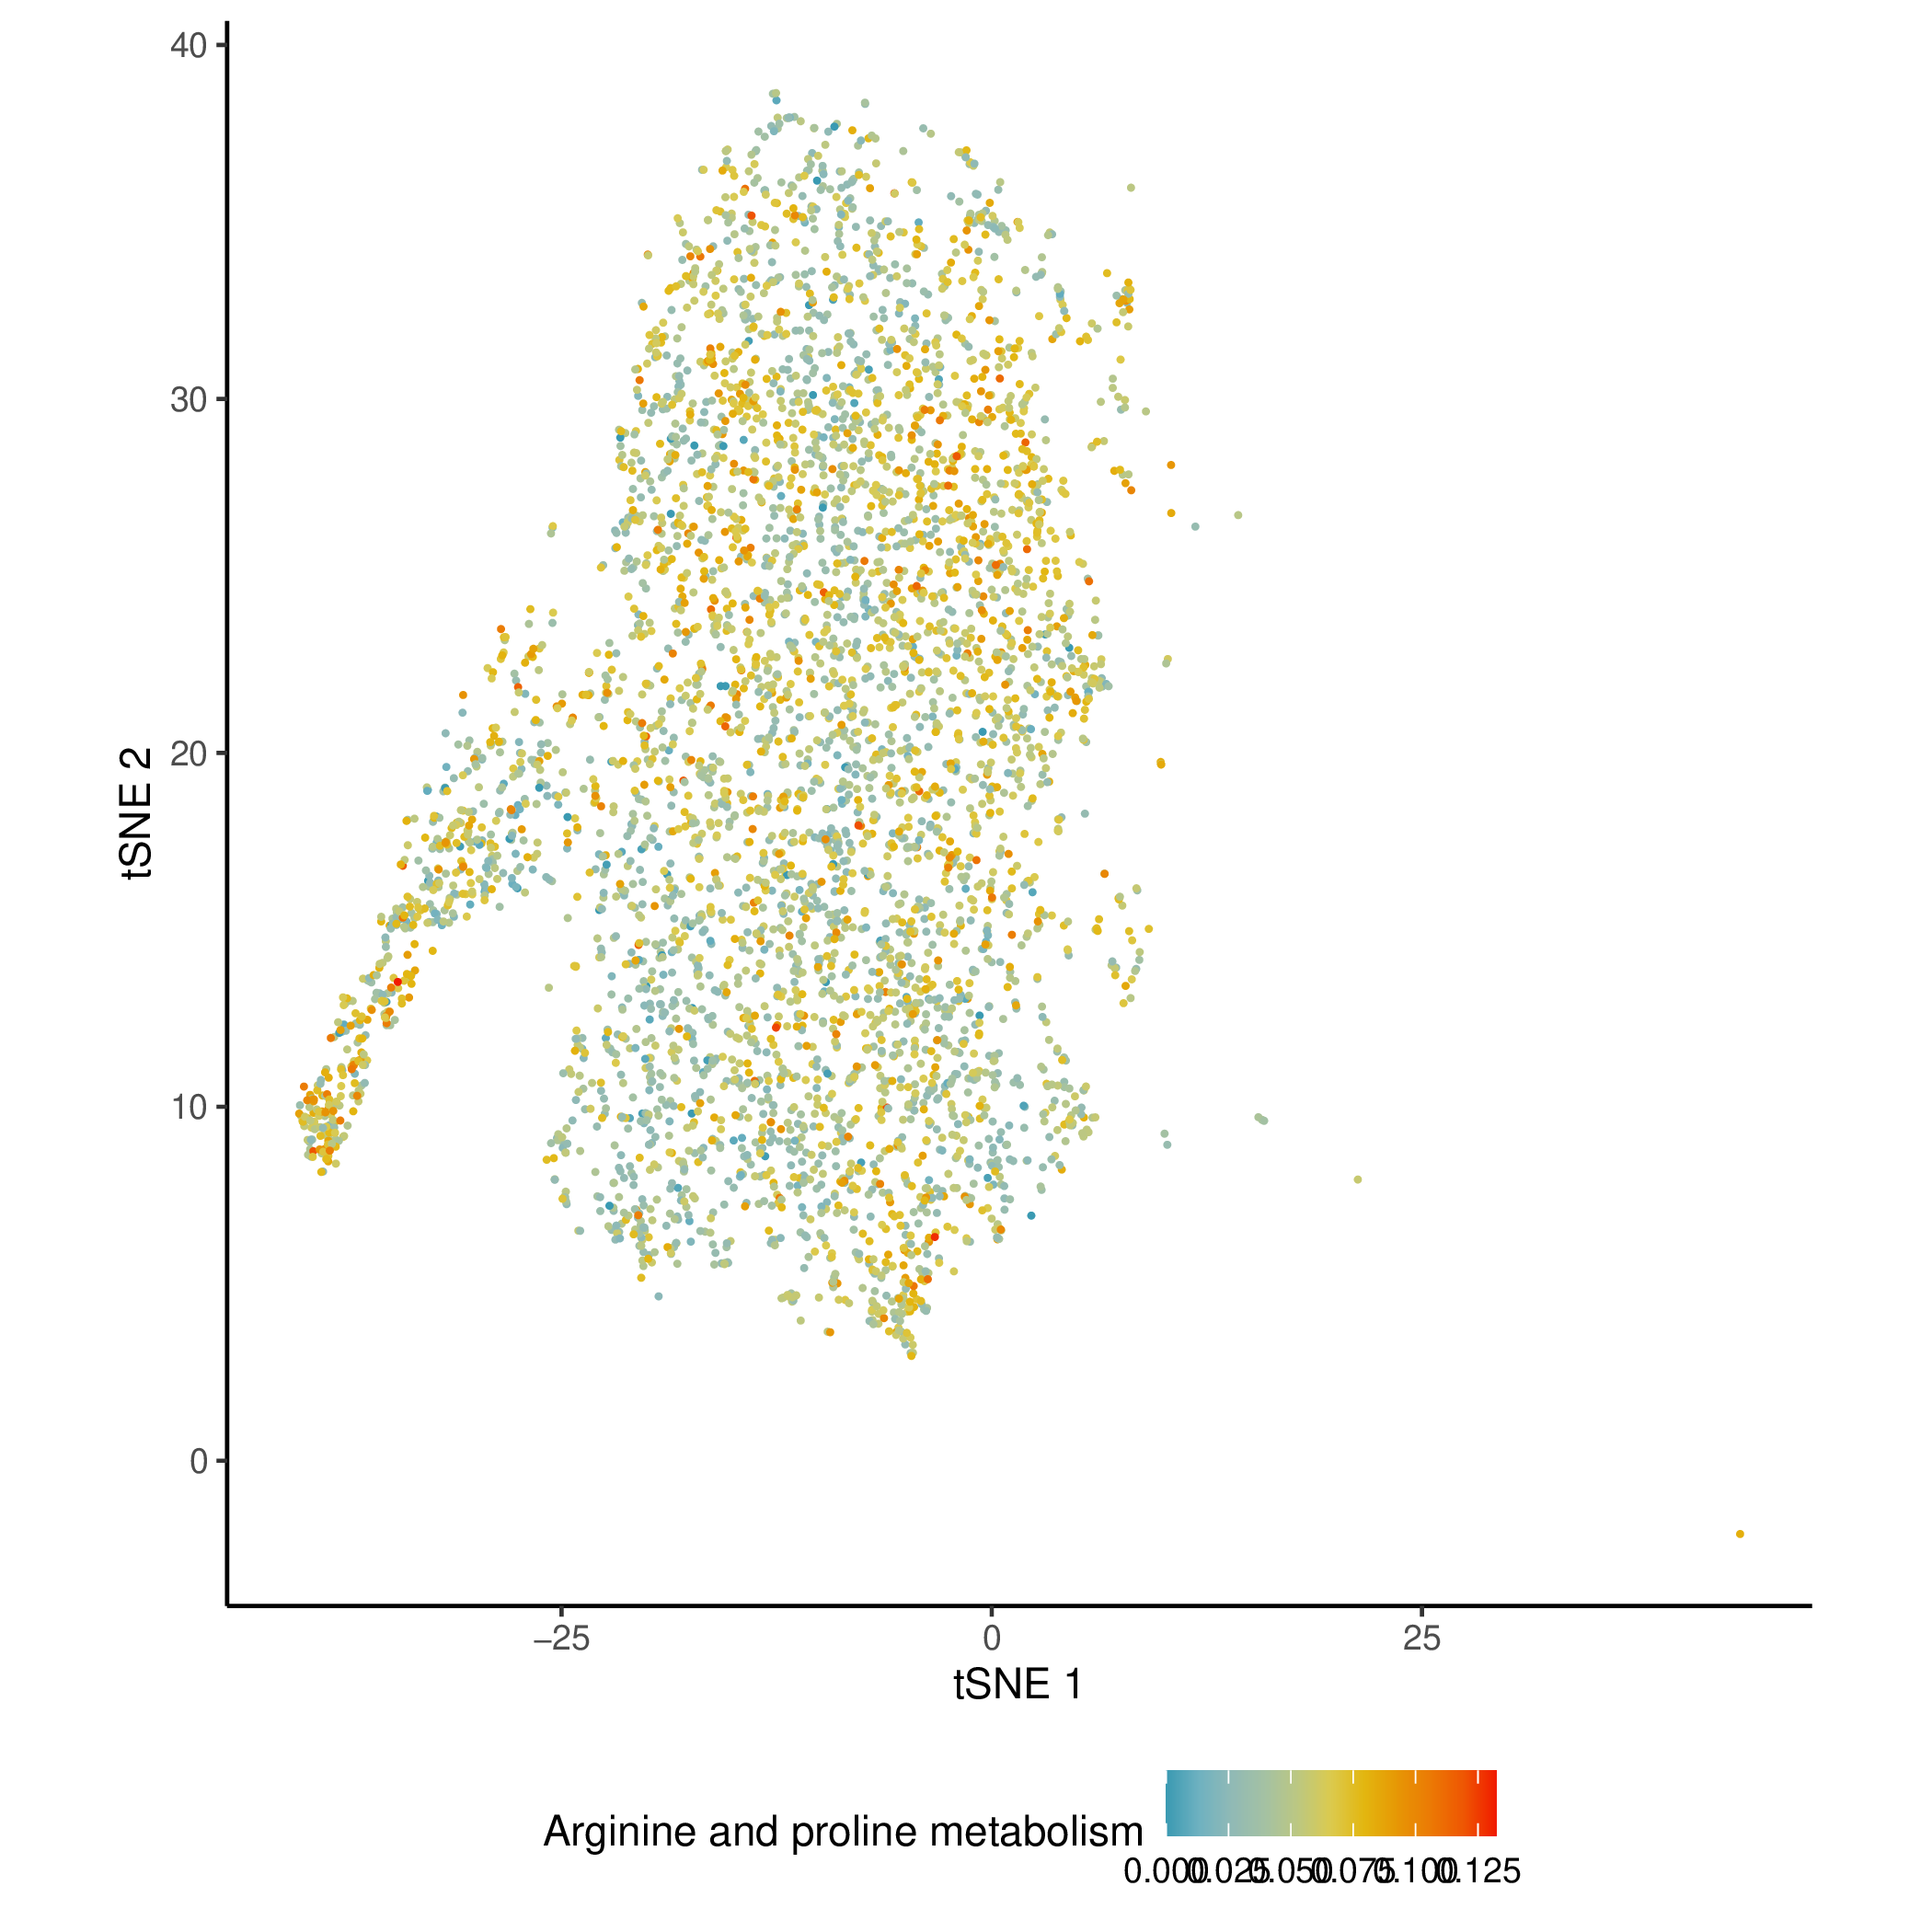
- Chart Interpretation: Project the enrichment score of a specific metabolic pathway (such as "arginine and proline metabolism") onto t-SNE or UMAP dimensionality reduction plots.
- Each point represents a cell.
- Color: Indicates the enrichment score of the cell in the pathway. Redder colors indicate higher activity.
- Analysis Points:
- Intuitively link metabolic pathway activity to predefined cell populations (such as T cells, B cells). You can clearly see whether a metabolic pathway is specifically highly expressed in a particular cell subpopulation.
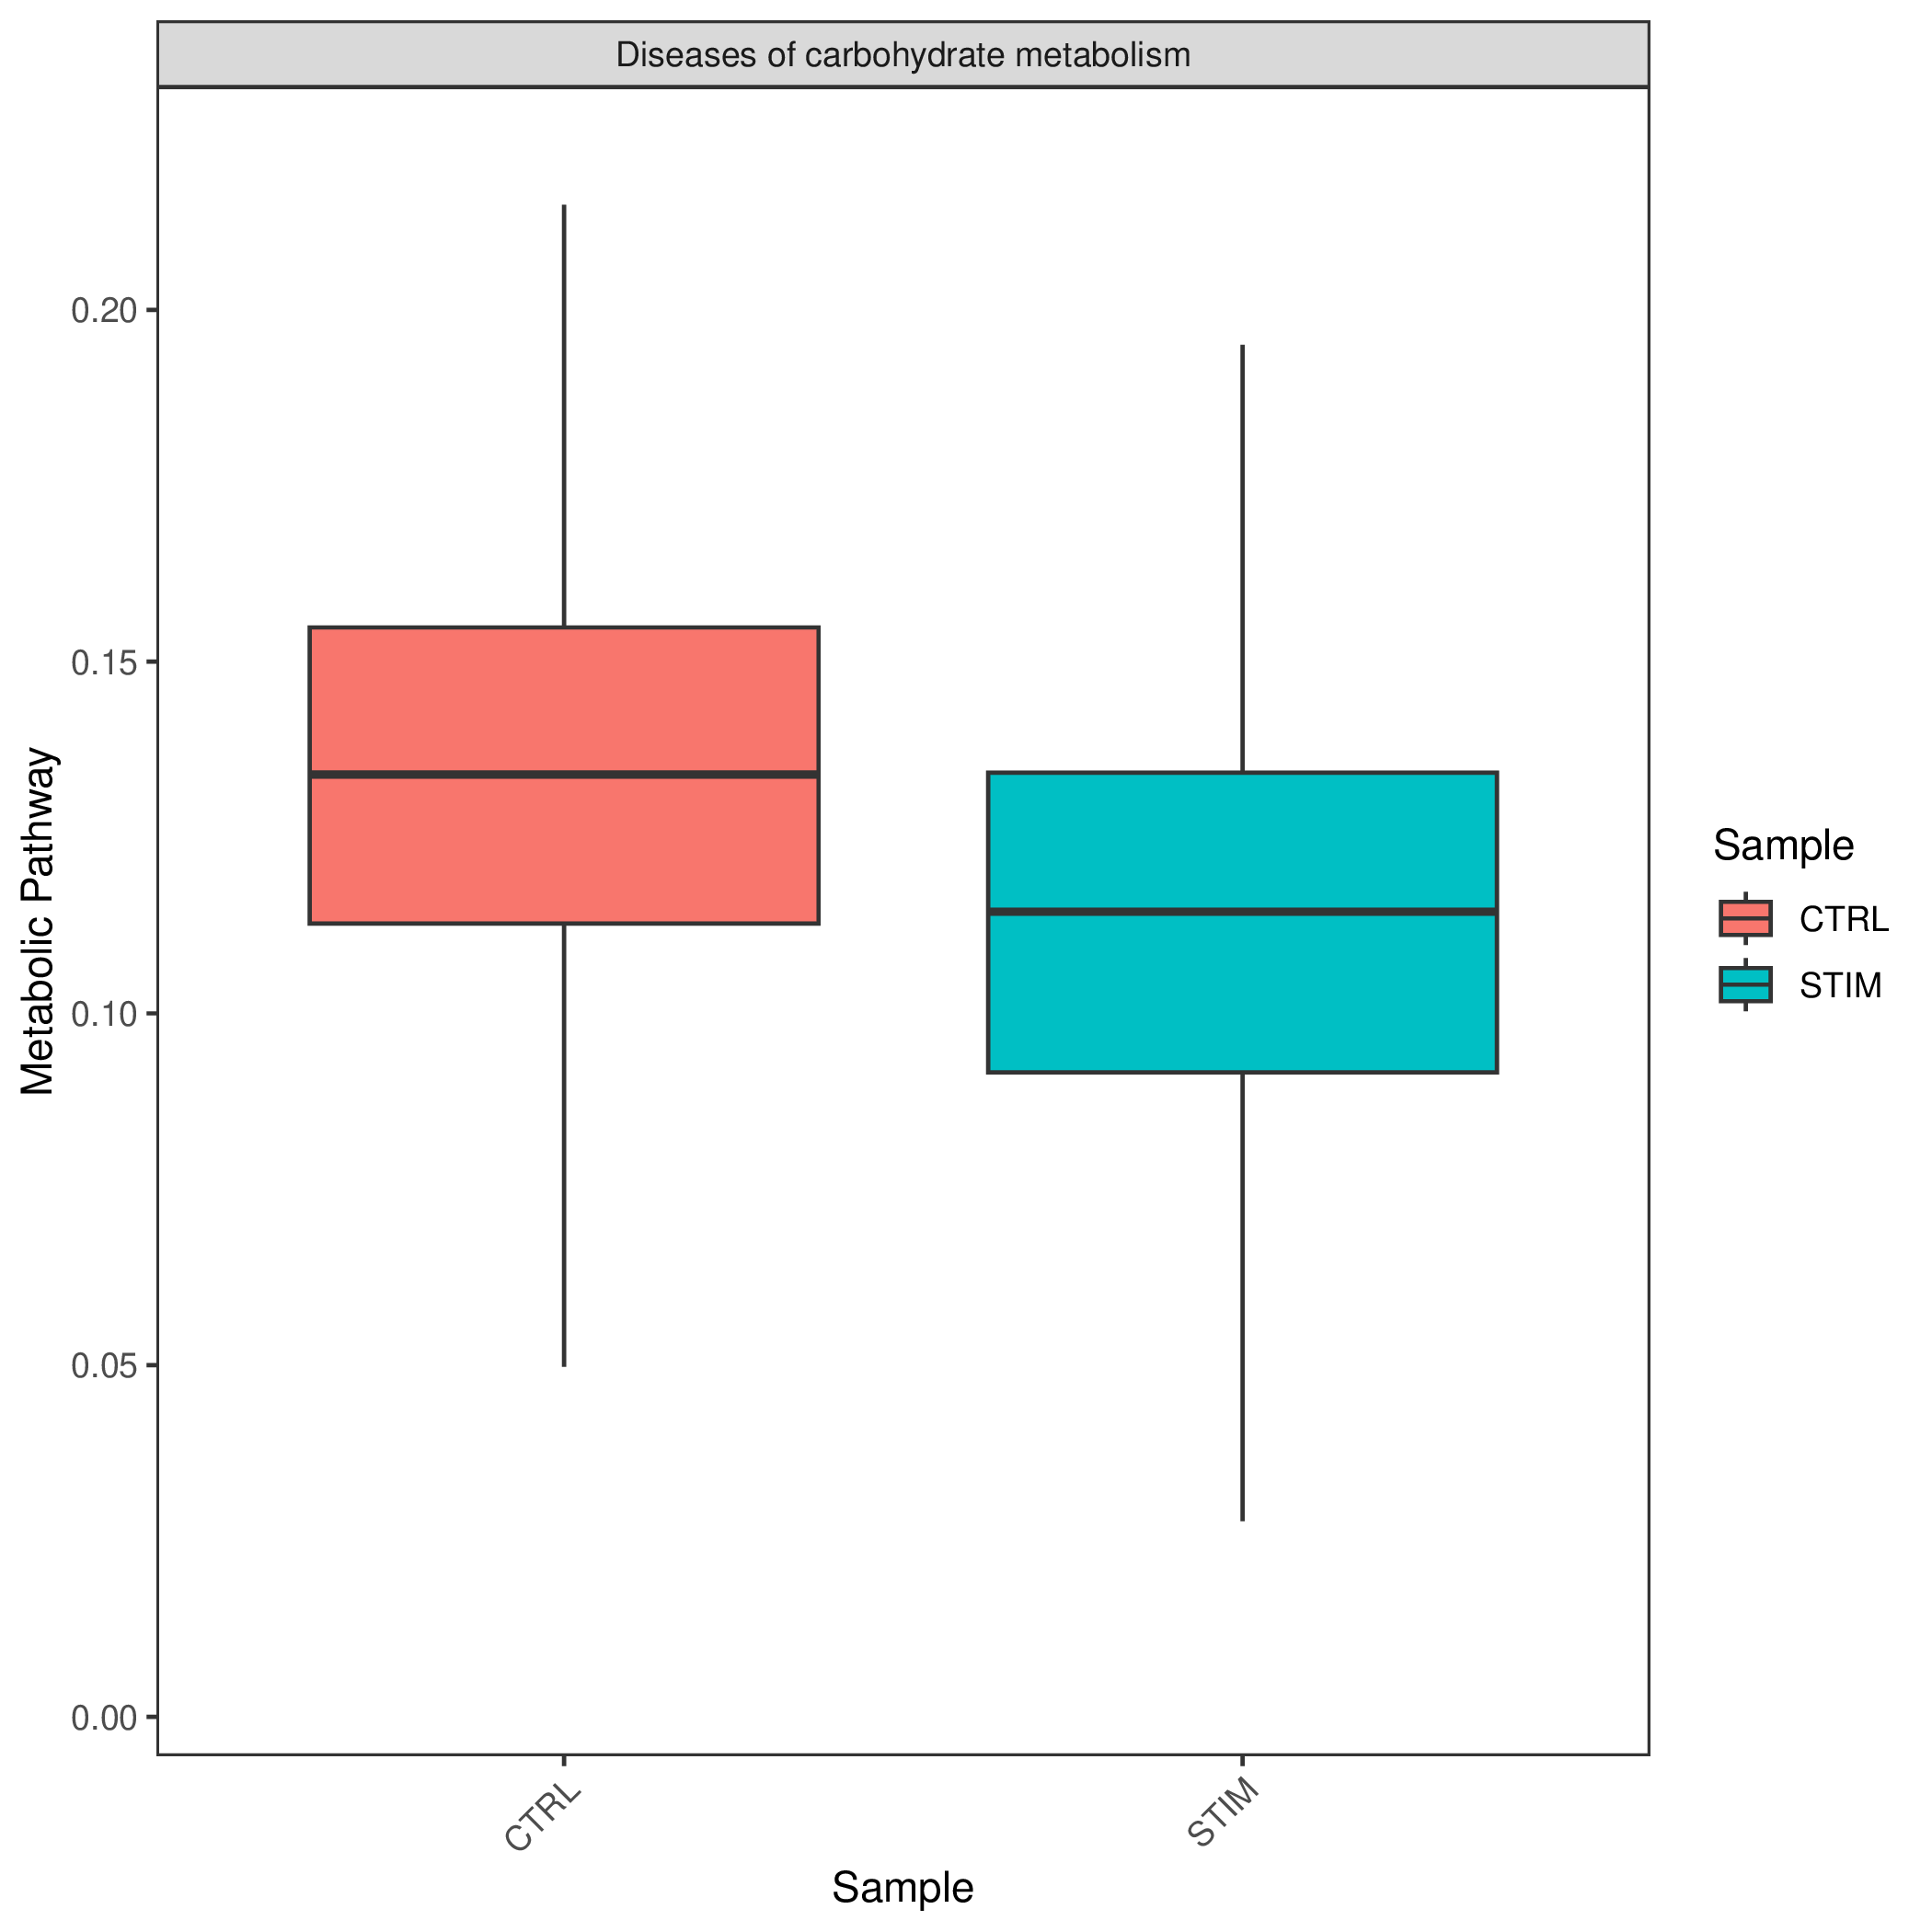
KEGG Metabolic Entry Group Type Activity Score Boxplot
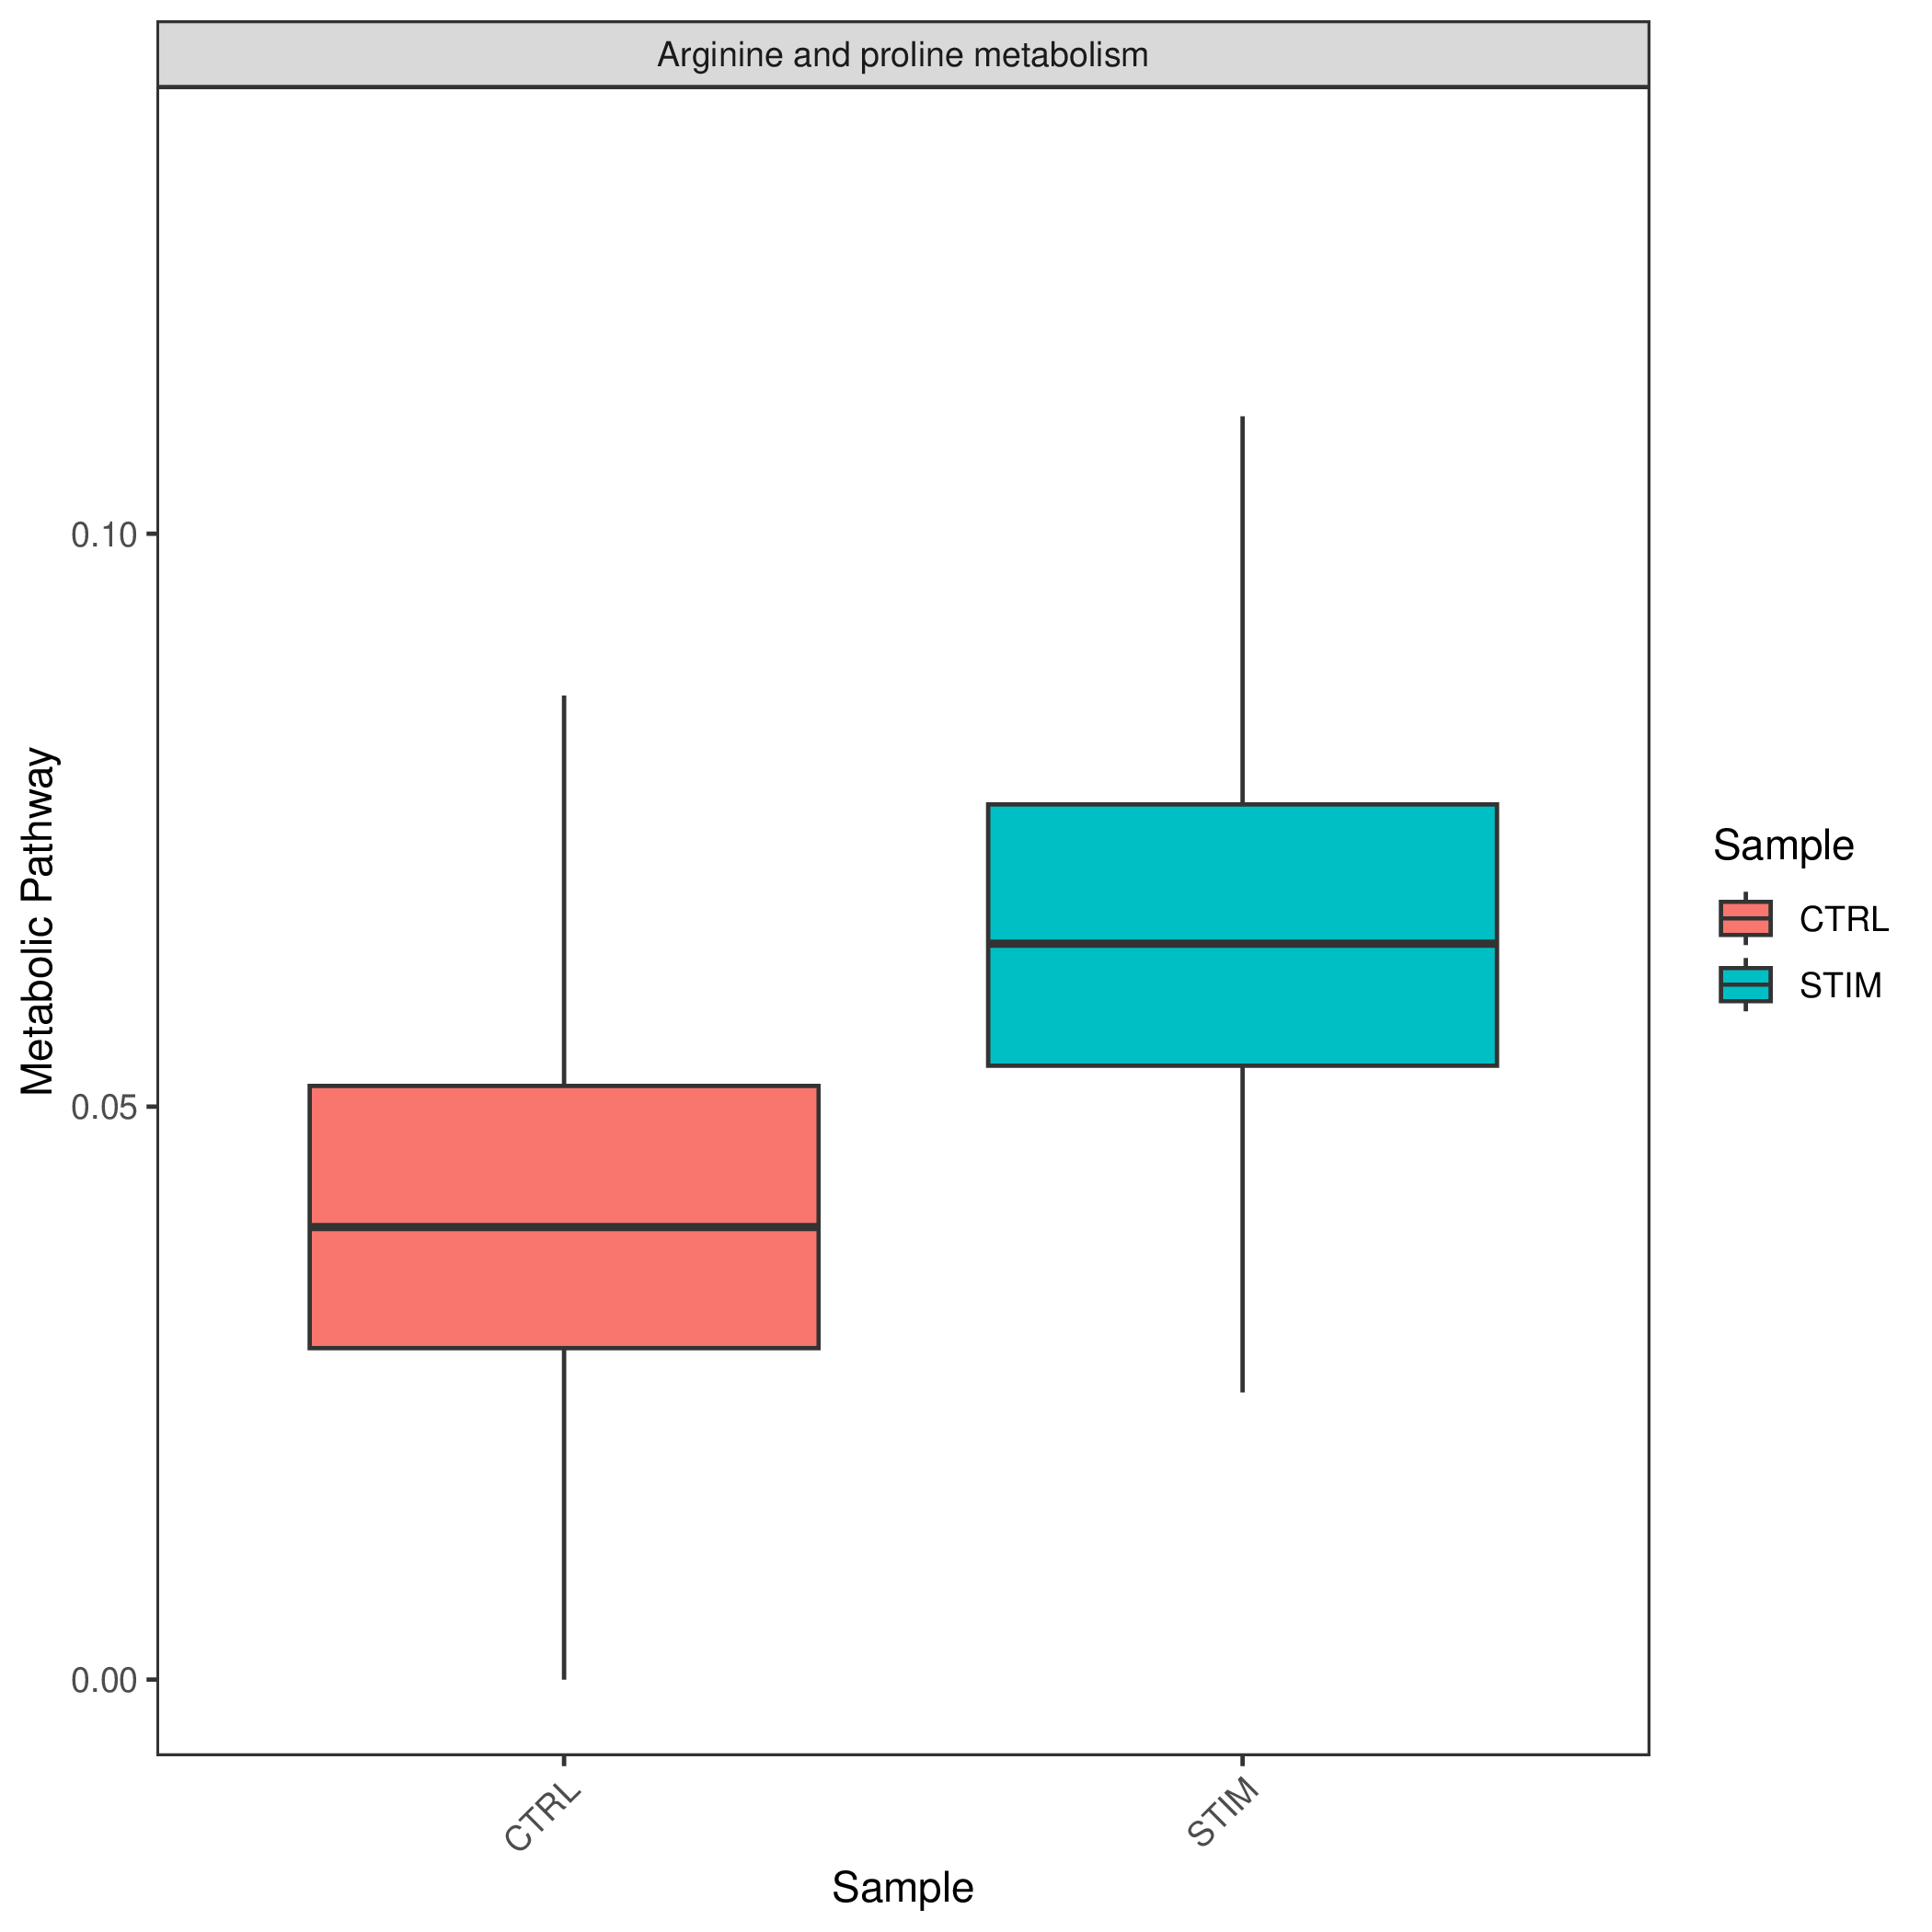
- Chart Interpretation: Display the distribution of enrichment scores for specific metabolic pathways in different samples or groups in the form of boxplots or violin plots.
- Analysis Points:
- Statistically compare metabolic pathway activities between different groups (such as tumor vs. paracancerous). The figure usually shows statistical significance (p-value), providing statistical support for inter-group differences.
REACTOME Pathway Results
Grouped Activity Average Score Bubble Plot
- Chart Interpretation: Similar to the KEGG bubble plot, showing the enrichment of REACTOME pathways.
Grouped Activity Average Score Heatmap
- Chart Interpretation: Similar to the KEGG heatmap, showing the enrichment of REACTOME pathways.
Activity Score Mapping Results on Dimensionality Reduction Plots
- Chart Interpretation: Similar to the KEGG dimensionality reduction plot, showing the enrichment of REACTOME pathways.
REACTOME Metabolic Entry Group Type Activity Score Boxplot
- Chart Interpretation: Similar to the KEGG boxplot, showing the enrichment of REACTOME pathways.
Result File List
| File Name/Directory | Content Description |
|---|---|
KEGG/ | Stores all analysis result charts and data based on the KEGG database. |
REACTOME/ | Stores all analysis result charts and data based on the REACTOME database. |
KEGG/KEGG_scores.csv | Core data: Contains the original enrichment scores of each cell in each KEGG metabolic pathway. |
REACTOME/REACTOME_scores.csv | Core data: Contains the original enrichment scores of each cell in each REACTOME metabolic pathway. |
Application Case
Case: scMetabolism Reveals Metabolic Reprogramming in Colorectal Cancer Liver Metastasis
- Literature: Wu, Y., et al. (2022). Spatiotemporal Immune Landscape of Colorectal Cancer Liver Metastasis at Single-Cell Level. Cancer Discovery.
- Background: Colorectal cancer liver metastasis (CRLM) is the main cause of patient death. Researchers want to understand how the metabolic state of immune cells, especially myeloid cells, in the tumor microenvironment changes during tumor metastasis.
- Analysis Strategy: Researchers used scMetabolism to analyze single-cell transcriptome data from CRLM patients, focusing on the metabolic characteristics of myeloid cells (such as macrophages and monocytes).
- Core Findings:
- Identified specific metabolic characteristics of different myeloid cell subpopulations: Analysis found that a special type of
MRC1+CCL18+macrophages showed extremely high overall metabolic activity, far exceeding other myeloid cells. - Revealed the correlation between high metabolic activity and pro-tumor function: These highly metabolically active macrophages also highly expressed multiple genes related to immune suppression and tumor progression, indicating that their metabolic state may support their pro-tumor function.
- Provided potential therapeutic targets: By identifying highly expressed metabolic-related genes in macrophages (such as
MMP9,MMP12, etc.), new ideas were provided for developing therapeutic strategies targeting the metabolism of tumor-associated macrophages.
- Identified specific metabolic characteristics of different myeloid cell subpopulations: Analysis found that a special type of
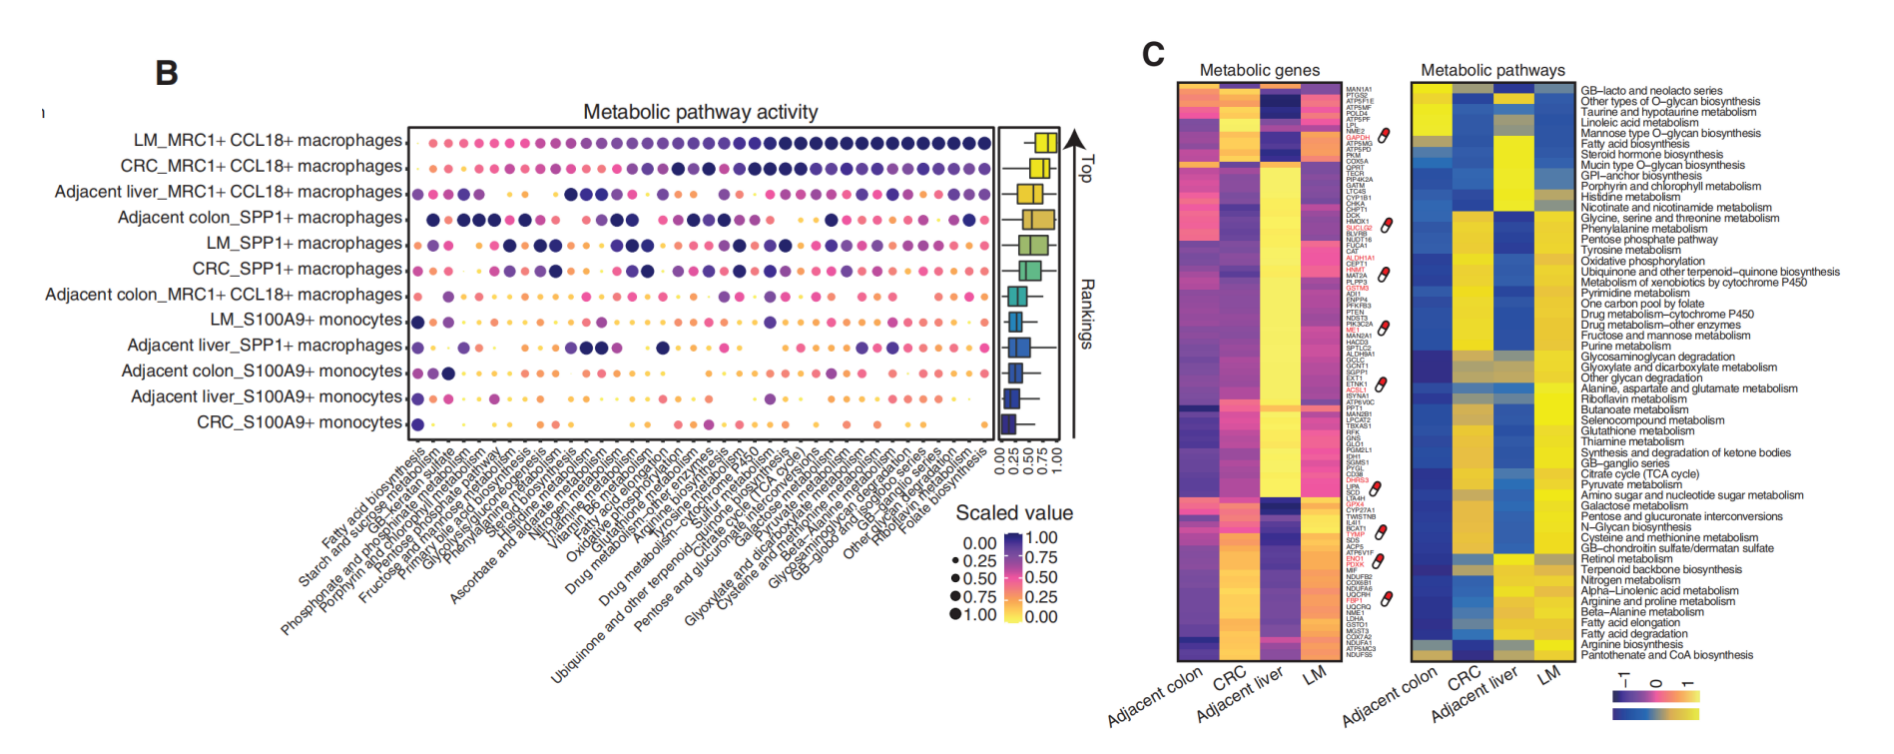
(Figure caption: (B) Metabolic activity analysis of myeloid cells, the size and color of the circles represent metabolic scores, and LM_MRC1+ CCL18+ macrophages have the highest scores. (C) Heatmap of average metabolic gene expression and metabolic pathway scores for this type of macrophages, with red genes representing potential drug targets.)
Precautions
1. Gene Set Coverage: The analysis results of scMetabolism rely on predefined gene sets. If key genes in a metabolic pathway are not included in the gene set or are not well captured in sequencing, it may affect the accuracy of the pathway score.
2. Transcript Level Does Not Completely Equal Metabolite Level: scMetabolism infers metabolic activity based on transcriptome data, which reflects what metabolic activities the cell is "preparing" to perform. The actual metabolite level is also affected by various factors such as post-translational modification, enzyme activity regulation, and substrate availability. Therefore, any key findings are best verified through experimental methods such as metabolomics.
3. Focus on Consistent Trends: Small changes in a single pathway may not be sufficient to draw conclusions. Focus should be on metabolic pathways that show consistent changing trends across different databases (KEGG and REACTOME) and different visualization methods (heatmaps, bubble plots, dimensionality reduction plots).
Frequently Asked Questions (FAQ)
Q1: How is the score of scMetabolism calculated? Should I use VISION or AUCell method? A: scMetabolism integrates multiple scoring methods. AUCell (platform default) calculates enrichment scores based on the ranking of gene expression and is insensitive to the absolute value of gene expression, making it more robust. VISION considers the covariance relationship between genes and can provide more information in some scenarios. Both have their advantages and disadvantages. Usually, the results of AUCell are sufficient to discover major metabolic heterogeneity. On the platform, you can choose different methods for experimentation and comparison according to your needs.
Q2: Why is the score of a pathway very low, but this does not match my expectations? A: First, check if the pathway contains a sufficient number of genes in the gene set of your selected species. Second, check if the overall expression level of these genes in your data is too low (possibly due to technical reasons such as dropout). Finally, as mentioned earlier, downregulation at the transcript level does not completely represent inhibition of metabolic activity; there may be changes at other regulatory levels.
Q3: How to select key metabolic pathways for downstream analysis? A: You can select pathways with the most significant differences between groups (large differences in color and size) from the bubble plot. You can also select pathway clusters that show specific high or low expression patterns in specific cell subpopulations from the heatmap. Combined with your biological questions, prioritize the pathways most relevant to your research direction for in-depth analysis.
References
- Wu Y, Yang S, Ma J, et al. Spatiotemporal Immune Landscape of Colorectal Cancer Liver Metastasis at Single-Cell Level. Cancer Discov. 2022;12(1):134-153. doi:10.1158/2159-8290.CD-21-0316